Thursday, June 17, 2010

Approach and rationale to our statistical analysis

Data Collection
Overall, the data collected was good and there was no rejection.

Hypothesis Testing
1. Null Hypothesis: There is NO significant relationship between a person's oral temperature and axilla temperature.
2. Alternative Hypothesis: There IS a significant relationship between a person's oral temperature and axilla temperature.

Criteria to "Reject" or "Accept" the Null Hypothesis:
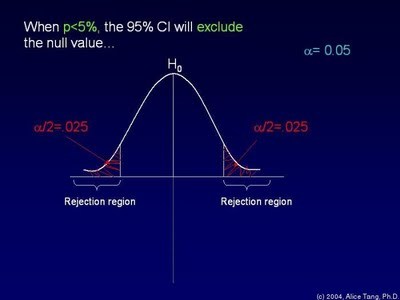
1. The decision rests on the p-value test statistic in relation to the user-defined α (alpha).

2. Alpha refers to the significance level. At this critical region, the range of values of the test statistic indicates that there IS a significant relationship and that the null hypothesis is rejected.

3. If the test statistic falls in the critical region (ie. p-value is ≤ α), it would lead to the rejection of the Null Hypothesis. In other words:

If p is ≤ α, we REJECT the Null Hypothesis.
If p is > α, we FAIL TO REJECT null hypothesis and we've to ACCEPT the Alternative Hypothesis.


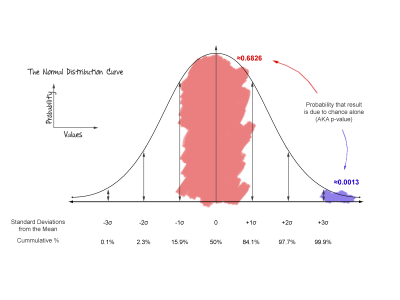
In our study, we have set α at 0.05.

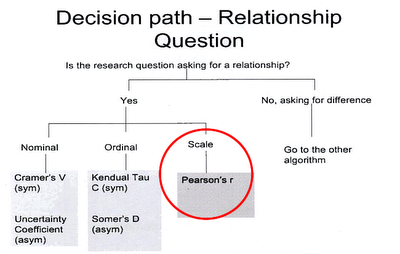
Choosing an appropriate statistical test

The statistical test depends whether the research question is about:

- Difference, or
- Correlation.

Our study is about correlation.


source: Chia, C. Y. (2008). Statistics in health sciences. (4th ed.). Singapore: McGraw Hill Education


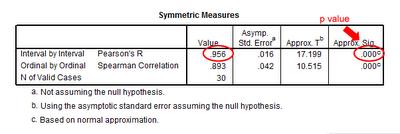
Since both of our variables in question are scale variables, and guided by the above decision path, we use Pearson's r to do the testing.

What is Pearson's r?

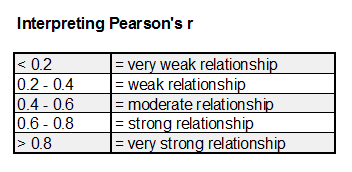
1. Pearson's r let us know the strength and direction of the linear association between two scale variables.

2. This correlation coefficient indicates the strength of the correlation.

3. Its limit ranges from -1 to +1. The + or - values indicates the direction of the correlation and lets us know how the variables are related.

4. Values near -1 indicates a strong negative relationship and is visually represented by a downward slope of the samples in a graph, while values near +1 indicates a strong positive relationship and an upward slope of the graph.

5. The closer the correlation coefficient approaches zero, the weaker the relationship between the two variables.

Tuesday, June 8, 2010

SPSS and interpreting the results


Variable view.


Data view

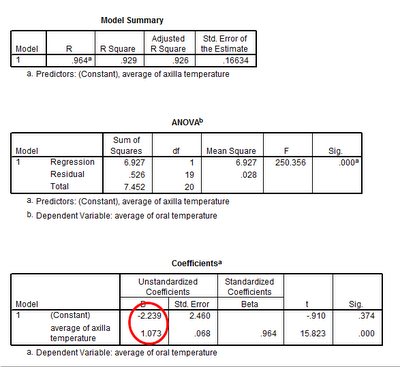
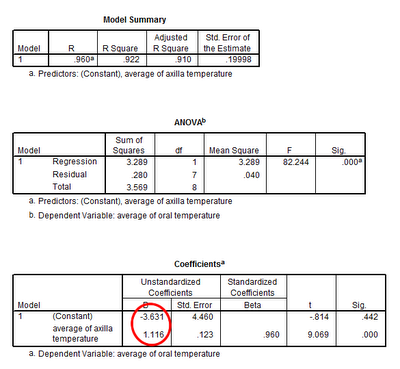
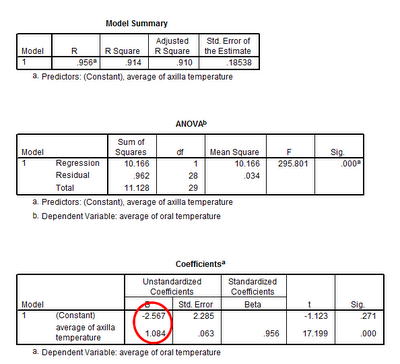
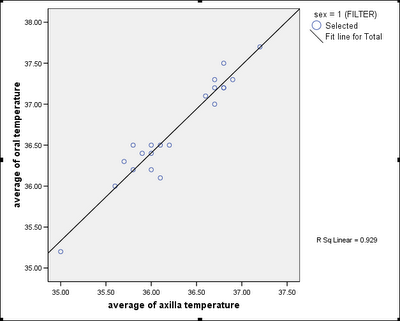
Using the data, we generated a Scatter Plot of Oral vs Axilla Temperature for Female.

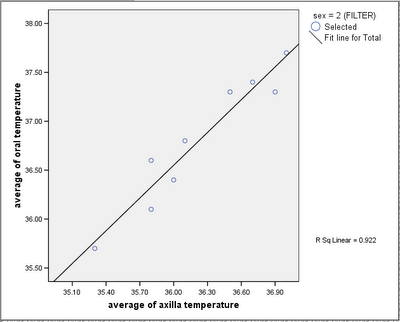
And also a Scatter Plot of Oral vs Axilla Temperature for Male.

This is the Pearson's R coefficients for Females & Males in the following table:
The table shows Pearson's correlation coefficients of 0.964 for Females & 0.960 for Male.


The association for Males is r=0.960, p=0.000, N=9 and the [Female]'s association is r=0.964, p=0.000, N=21.

Both are >0.8, indicating a VERY STRONG, SIGNIFICANT and POSITIVE relationship between a person's oral & axilla temperatures for both Males and Females.

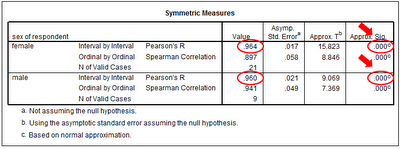
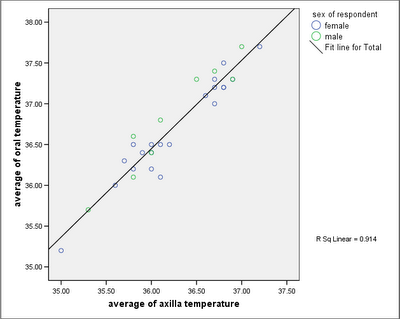
A Scatter Plot of oral temperature vs axilla temperature for BOTH Male & Female.


The COMBINED table above shows the Pearson's correlation coefficient of 0.956 for Males & Females (ie. ALL samples). It indicates a VERY STRONG, SIGNIFICANT and POSITIVE RELATIONSHIP between oral temperature and axilla temperature for Males & Females.
---------------------------------------------------------------------------

COMPUTING THE REGRESSION LINES FOR Males, Females and Males & Females (ie. y = mx + c)

Since a relationship exists between oral and axilla temperatures, we now perform linear regressions using SPSS to construct equations that can predict a person's oral temperature from his/her axilla temperature.

The data table below is for Females samples.


The linear equation for Female is
Oral Temp Female = 1.073 x (Axilla Temp Female) - 2.239 °C


The data table below is for Male samples.


The linear equation for Males is
Oral Temp Males = 1.116 x (Axilla Temp Male) - 3.631 °C


The data table below is for Male & Female samples.


The linear equation for Male & Female is
Oral Temp = 1.084 x (Axilla Temp) - 2.567 °C
---------------------------------------------------------------------------

HYPOTHESIS TESTING

We had earlier selected the critical value or common significance level or α at 0.05.

Since the p values (red arrows) for Males, Females and Males & Females are ALL = 0.000 which is less that our alpha of 0.05, WE REJECT OUR NULL HYPOTHESIS.

Thus, we ACCEPT our ALTERNATIVE HYPOTHESIS that THERE IS A SIGNIFICANT RELATIONSHIP BETWEEN A PERSON'S ORAL AND AXILLA TEMPERATURE (specifically a positive one).

Saturday, June 5, 2010

The average normal human oral temperature is 36.9.


In general, for the same individual:

Axilla (armpit) temperature is usually 0.3 to 0.6 lower than an oral temperature.

Oral temperature is about 0.3 to 0.6 lower than a rectal or ear (tympanic) temperature.

Conversely, Tympanic (ear) and Rectal temperatures are 0.3 to 0.6 higher than oral temperature.

The following table shows the normal ranges for human temperature taken using different routes as reported by Sund-Levander M, Forsberg C, Wahren LK.:


While debate remains as to whether 'core body temperature' taken using the rectal route best reflect the body's 'true' internal temperature, factors like:
embarrassment to the patient,
inconvenience to the patient and nurse,
ease of use for the nurse,
expediency and
speed and accuracy in obtaining temperature readings, etc

All mean that tympanic thermometers are favoured in adult wards as the temperature can be obtained in ONE second instead of waiting for a minute or even longer for an electronic oral thermometer.

However, axilla temperature is taken using electronic themometers for children under 6 months in pediatrics wards since their ear canals are still not large enough to accomodate a regular tympanic thermometer.