
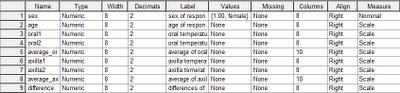
Variable view.
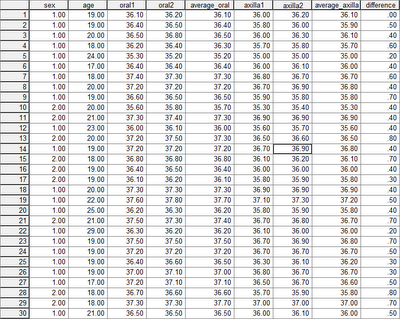
Data view
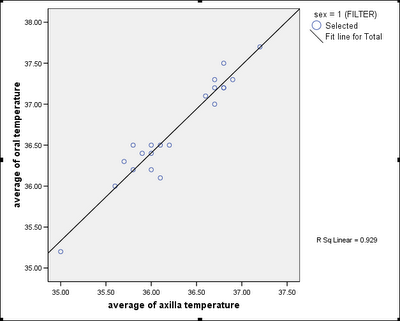 Using the data, we generated a Scatter Plot of Oral vs Axilla Temperature for Female.
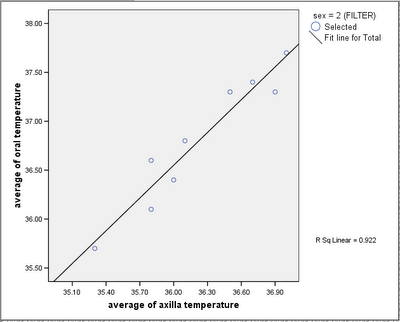 And also a Scatter Plot of Oral vs Axilla Temperature for Male.
This is the Pearson's R coefficients for Females & Males in the following table: 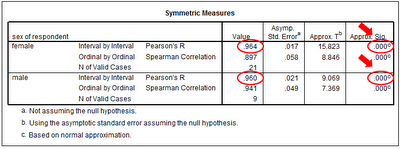
The table shows Pearson's correlation coefficients of 0.964 for Females & 0.960 for Male.
The association for Males is r=0.960, p=0.000, N=9 and the [Female]'s association is r=0.964, p=0.000, N=21.
Both are >0.8, indicating a VERY STRONG, SIGNIFICANT and POSITIVE relationship between a person's oral & axilla temperatures for both Males and Females.
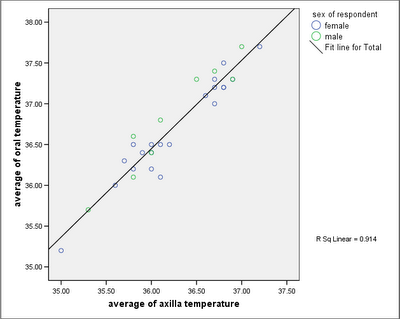 A Scatter Plot of oral temperature vs axilla temperature for BOTH Male & Female.
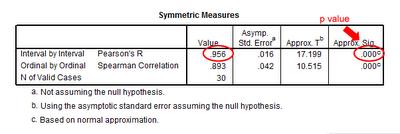
The COMBINED table above shows the Pearson's correlation coefficient of 0.956 for Males & Females (ie. ALL samples). It indicates a VERY STRONG, SIGNIFICANT and POSITIVE RELATIONSHIP between oral temperature and axilla temperature for Males & Females.
---------------------------------------------------------------------------
COMPUTING THE REGRESSION LINES FOR Males, Females and Males & Females (ie. y = mx + c)
Since a relationship exists between oral and axilla temperatures, we now perform linear regressions using SPSS to construct equations that can predict a person's oral temperature from his/her axilla temperature.
The data table below is for Females samples.
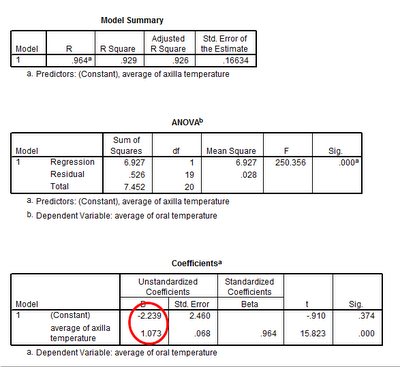
The linear equation for Female is
Oral Temp Female = 1.073 x (Axilla Temp Female) - 2.239 °C
The data table below is for Male samples.
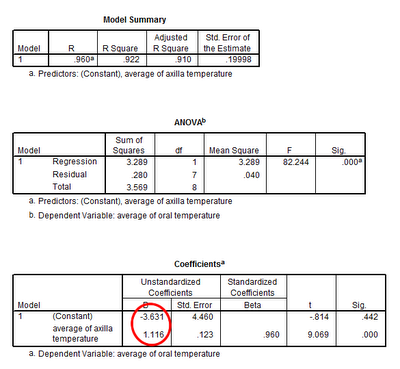
The linear equation for Males is
Oral Temp Males = 1.116 x (Axilla Temp Male) - 3.631 °C
The data table below is for Male & Female samples.
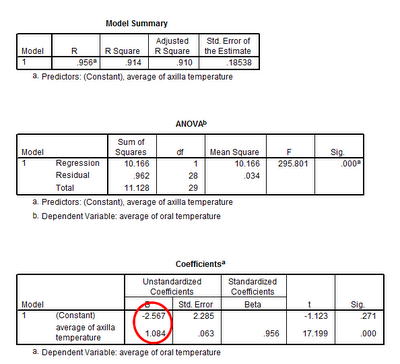
The linear equation for Male & Female is
Oral Temp = 1.084 x (Axilla Temp) - 2.567 °C
---------------------------------------------------------------------------
HYPOTHESIS TESTING

We had earlier selected the critical value or common significance level or α at 0.05.
Since the p values (red arrows) for Males, Females and Males & Females are ALL = 0.000 which is less that our alpha of 0.05, WE REJECT OUR NULL HYPOTHESIS.
Thus, we ACCEPT our ALTERNATIVE HYPOTHESIS that THERE IS A SIGNIFICANT RELATIONSHIP BETWEEN A PERSON'S ORAL AND AXILLA TEMPERATURE (specifically a positive one).
Great job in your data analysis. Any photos of the group members? Ms Chia
ReplyDelete